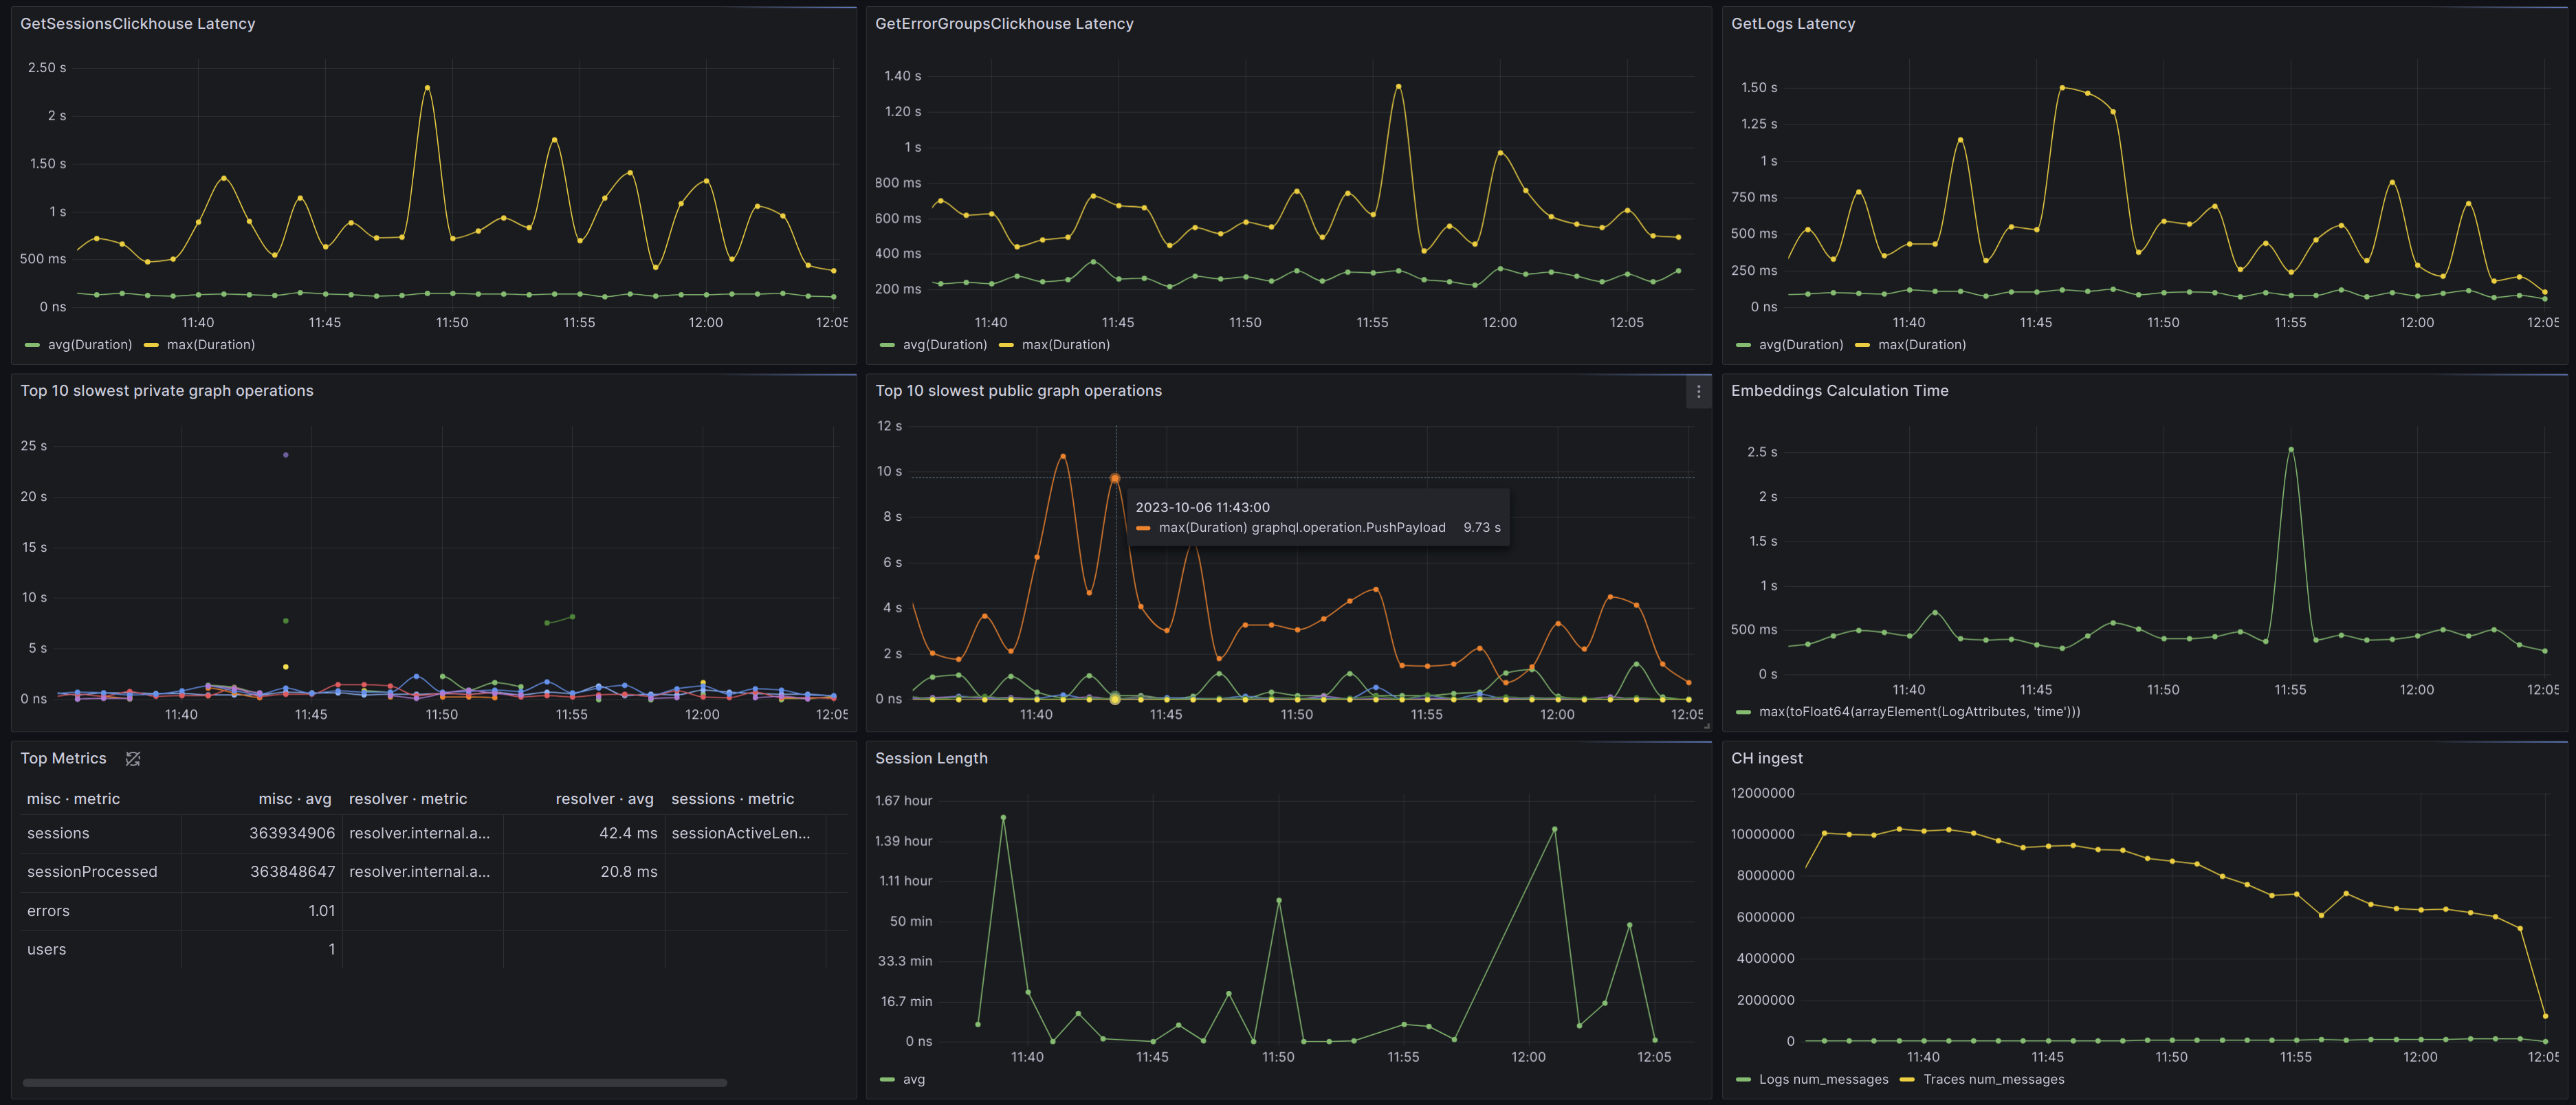
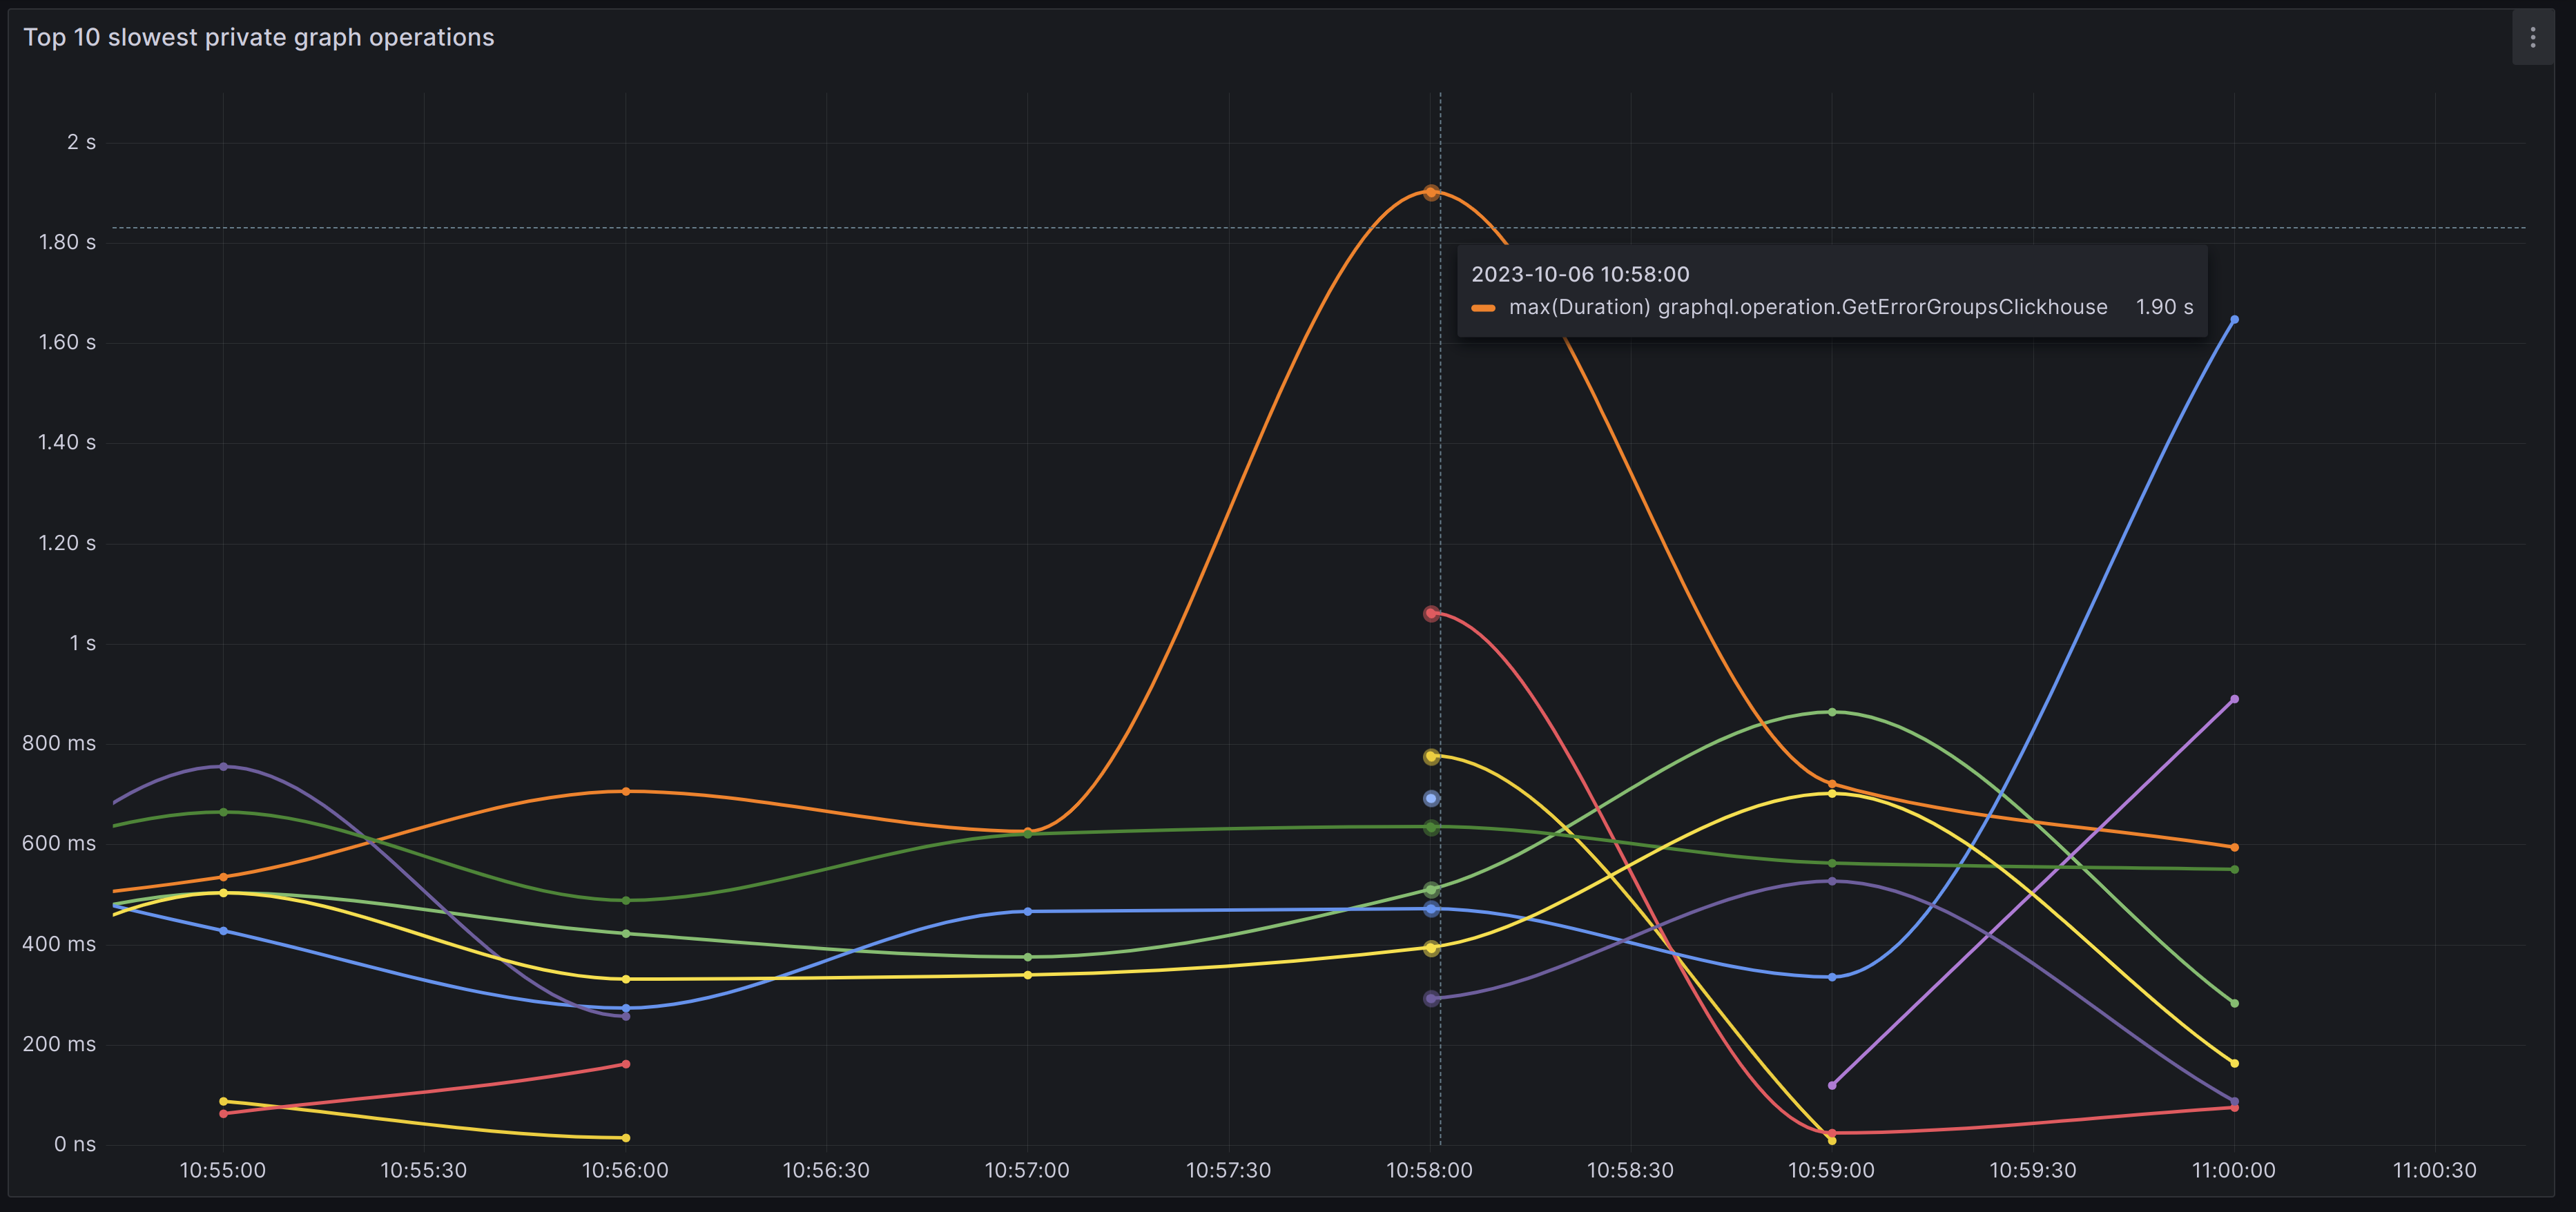
Overview
We support integrating with Grafana to visualize metrics from your applications frontend and backend. Track network request latency, application errors, and backend traces all in one place. You'll get customization into aggregate query types (p50, p99, etc.) for performance and availability metrics automatically captured from our SDKs, with the ability to report custom metrics and traces as well.

How it works
We expose a Grafana Data Source that you can configure in your own self-hosted or cloud-managed Grafana instance. Once you have your highlight.io account connected, you can build your own dashboards and write queries to our API. We also support exposing our backing analytics data store, ClickHouse, so that your team can write SQL queries and get raw access to slice / dice the data.
