Company
Product Features
Session Replay
Error Monitoring
General Features
Logging
Tracing
Metrics
Integrations
Grafana Integration
Highlight.io Changelog
Menu
Dashboard Management

Dashboard overview
At app.highlight.io/metrics, there is an overview of all dashboards in your project. Here, you can create or delete dashboards, or click into the dashboard you want to view / edit. If your project has many dashboards, you can filter on their name using the search.
By default, all projects have an "Insights" dashboard automatically created to show useful graphs and showcase many of the highlight.io metrics features.
Viewing / editing a dashboard
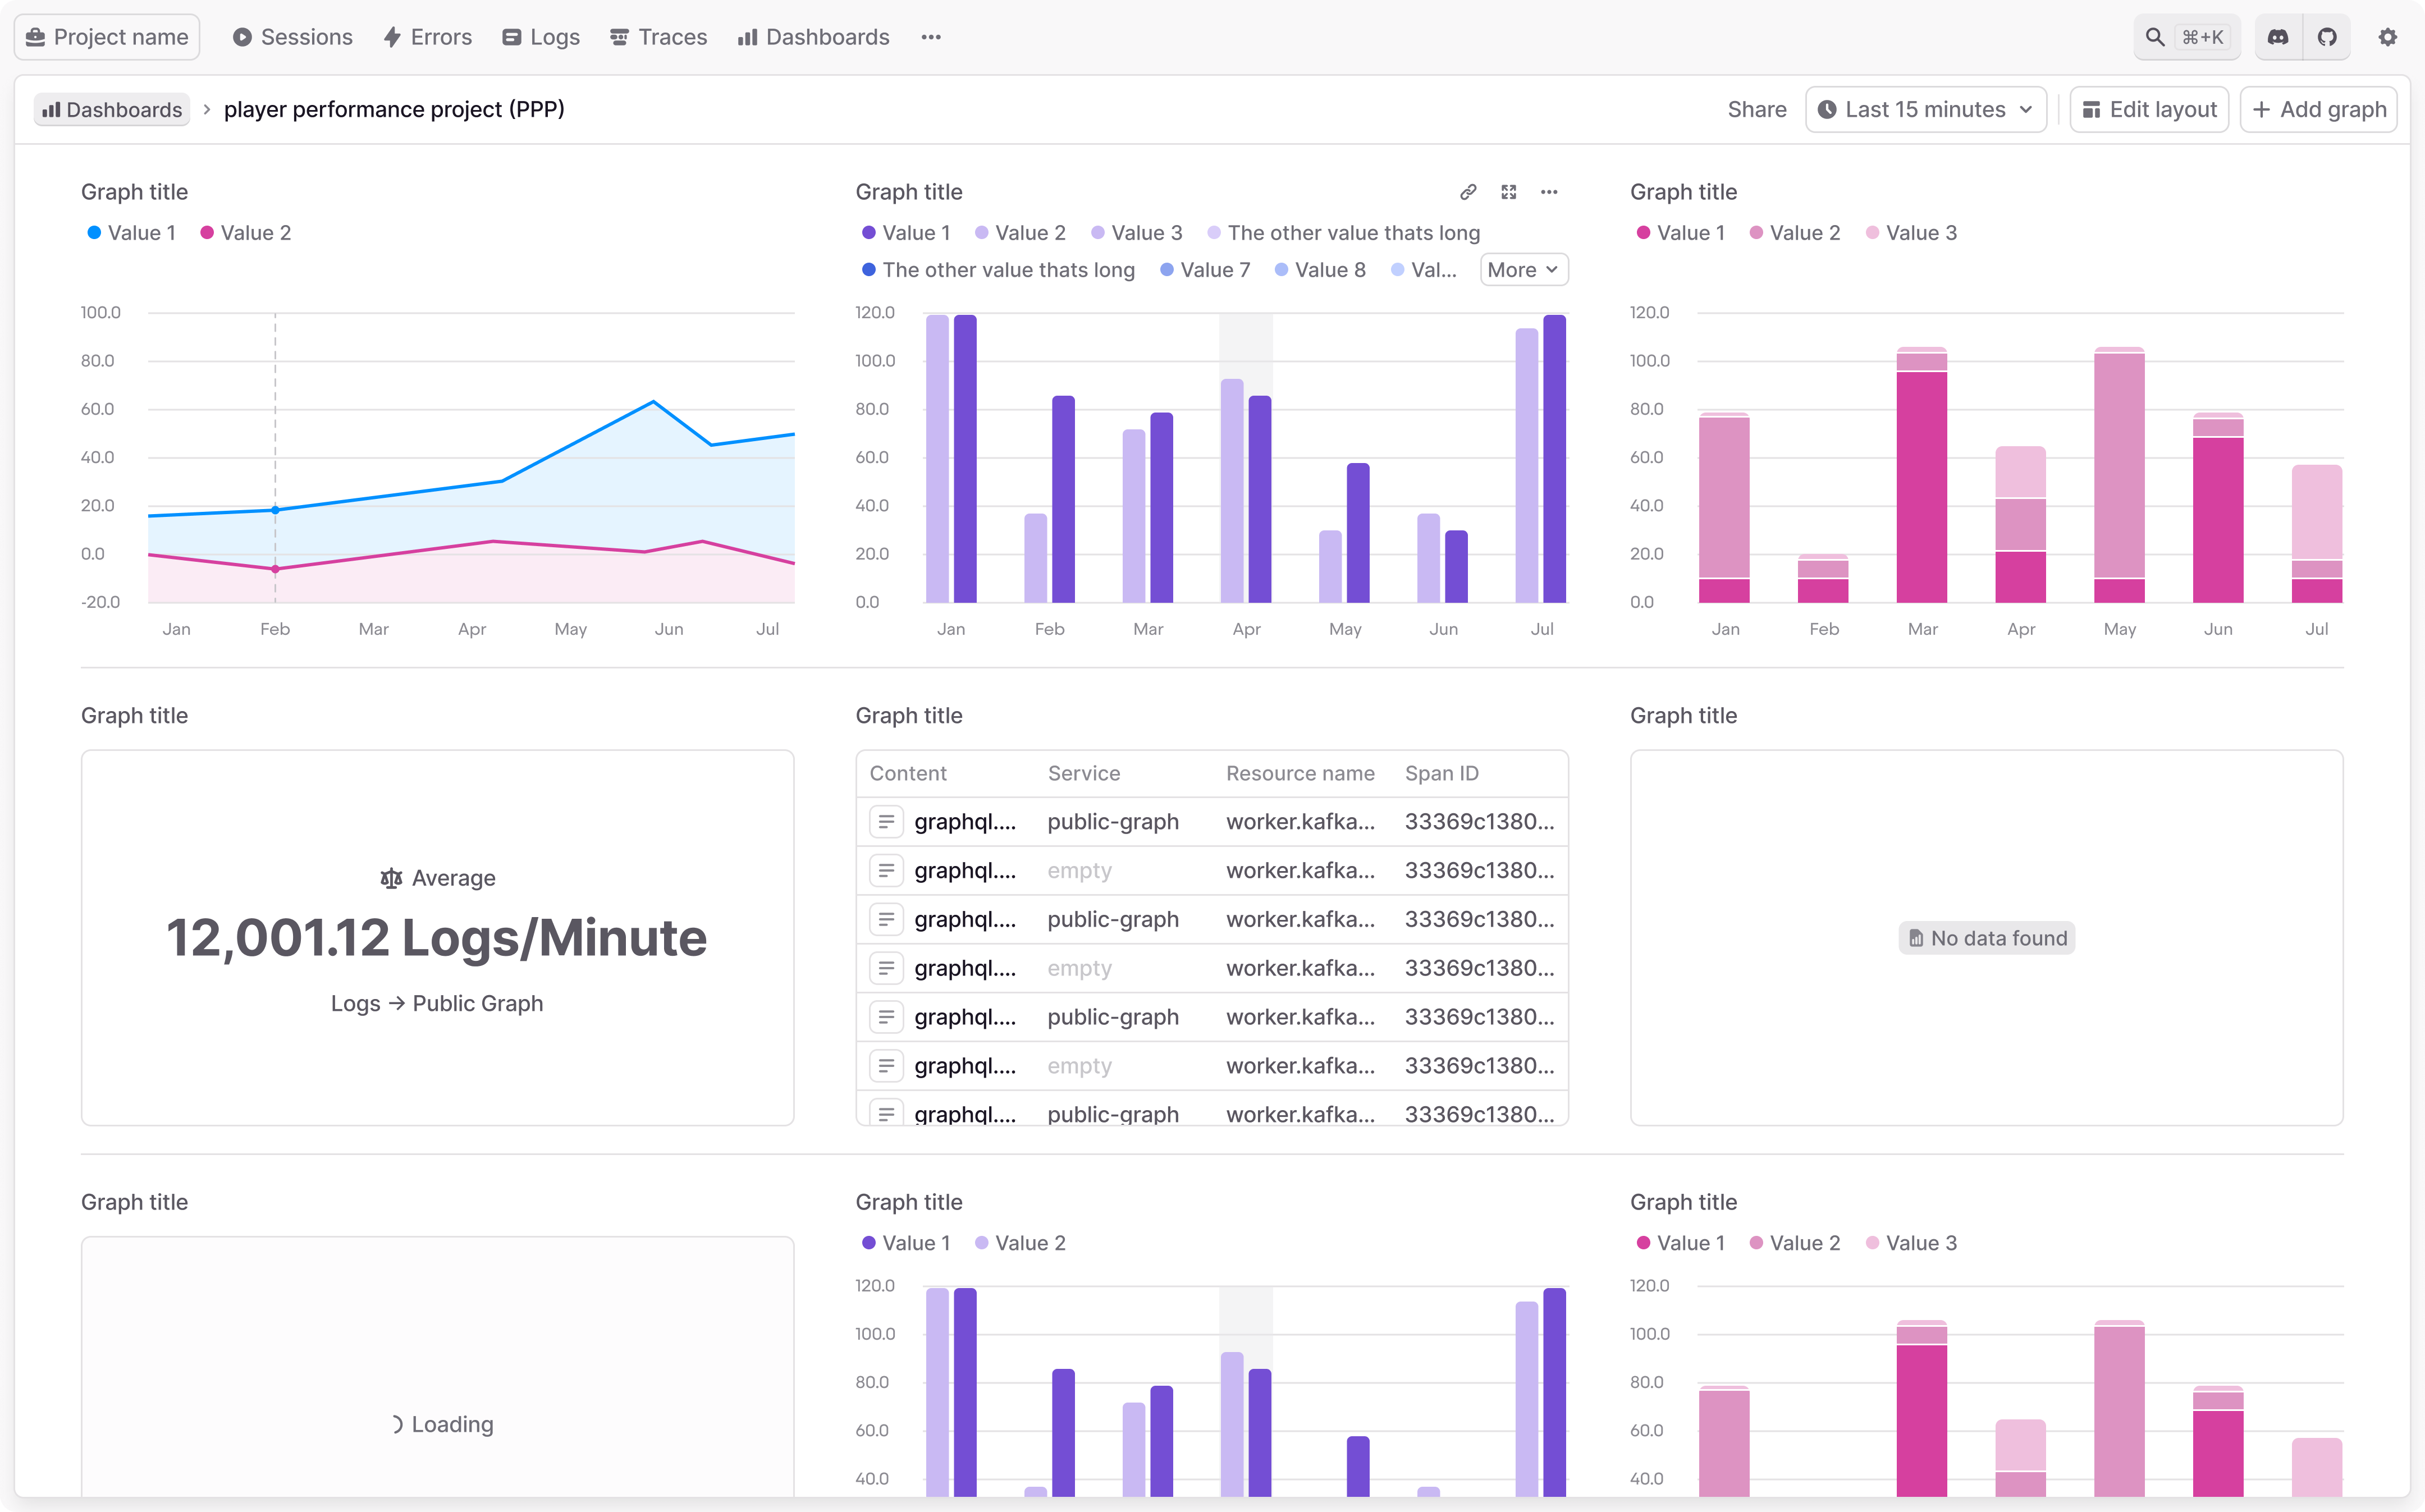
Within a dashboard, there are a few controls available at the top of the page:
- Date picker adjusts the queried time range for all graphs on the page, even those that don't show any timestamps. When you copy a dashboard's URL, the time range is persisted in that URL.
- Edit dashboard toggles edit mode to allow you to update the dashboard's name or drag and drop graphs to reorganize the dashboard. Using the "Cancel" button to exit edit mode will revert any changes made.
- Add graph opens the graph editor to create a new graph. You can read more here.
There are also controls available per graph, shown when hovering over each graph in a dashboard:
- Expand graph opens a larger version of the graph for more detail.
- Edit graph opens the graph editor to edit an existing graph. You can read more here.
- Delete graph removes an existing graph from the dashboard.